A couple of week ago on Divorce Ministry 4 Kids, we looked at a series of statics documenting the number of divorces in our country. Those statistics are telling and reveal just how commonplace divorce has become in our culture. In this article, we are going to look at some even more striking statistics regarding the number of children affected by divorce each year in this country, the number of births to single mothers and the number of kids living in single parent families. All of these children fall within the mission statement of Divorce Ministry 4 Kids. The statistics are striking, but I would implore you to remember as you review them that each statistic represents a real child whose world has been torn apart. They are so much more than just a number on a chart, and that is why we must not only be cognizant of their existence, but also prepared to minister to and serve them. Full data, along with the sources of information, used in each chart is included at the end of this file.
A complete listing of the data comprising the following charts is included in the pdf file accompanying this article (see link below).
Children Affected by Divorce
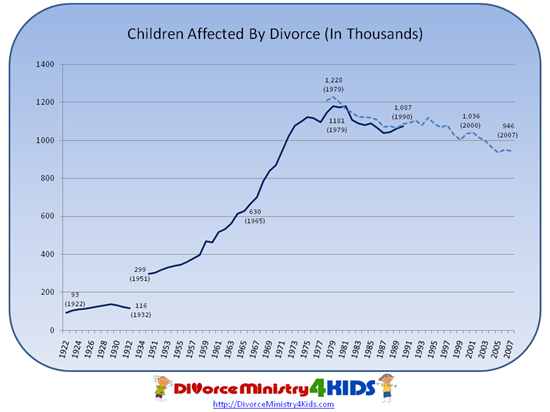
 Through 1990, The U.S. Federal Government collected and published national statistics regarding the number of children involved in divorces each year. In 1922, roughly 93 thousand kids saw their parents’ divorce. By 1932, that number had increased to 116 thousand. When the statistics pick up again in 1951, that number had already almost tripled up to 299 thousand. In 1960, before the divorce boom, the number stood at 463,000. The number of children of divorce first topped one million in 1972 at 1,021,000. It remained over one million every year through the end of the reporting in 1990 when the number of children was 1,075.000.
Beginning in 1991, we utilized the number of divorces and average number of children per family to estimate annual children of divorce. We carried this analysis backwards to 1979 to show how it compared to reported statistics. It appears to be slightly higher for most years; however the differences are not significant. Our calculated figures show that the estimated number of children of divorce actually decreased below 1,000,000 in 2003 for the first time in 21 years and stood at 946,000 in 2007.
Births to Single Mothers
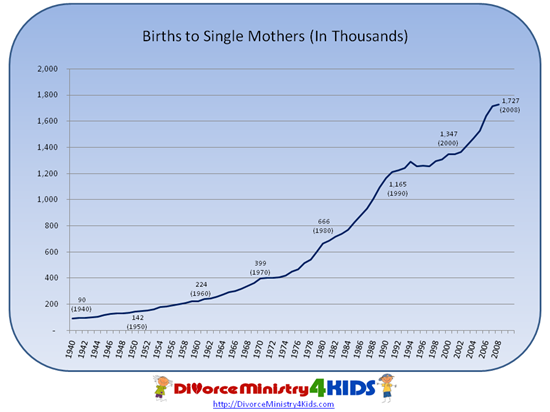 Although children born to single mothers do not necessarily suffer the same loss of the only world they have ever known (many have only known the world of single-parent families) as children of divorce, they do suffer through many of the same emotional and societal consequences as children whose parents have divorced. We consider them part of our ministry here at Divorce Ministry 4 Kids.
In 1940, “only” 90,000 children were born to single mothers. 30 years later in 1970, that number had increased by over a factor of 4 and stood at 399,000. It nearly quadrupled again in the next twenty years and stood at 1,165,000 in 1990. By 2008, 1,727,000 children came into this world without the benefit of a two-parent family. That represents an increase of 28% since 2000, 159% since 1980 and 1,818% since 1940.
Percentage of All Births to Single Mothers
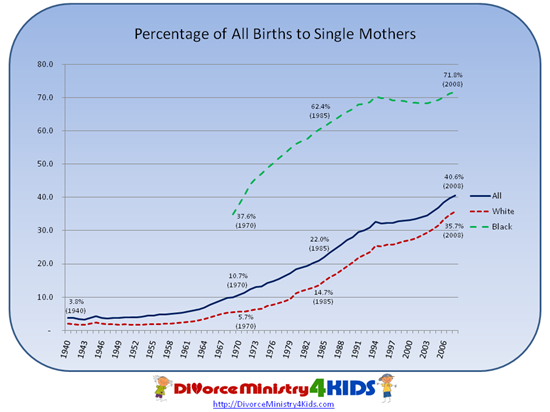 While the last chart reflects the raw number of births to single mothers, this chart shows what percentage of total births each year were births to single mothers.
In 1940, 3.8% of total births were to single mothers. Thirty years later in 1970, that figure had risen to 10.7%. 1970 is the first year for which we have these figures split between black and white families with 5.7% of births of white children to single mothers and 37.6% of black children. In 1995, 22.0% of all births were to single mothers.
The most recent information available was for 2008. In that year, a total of 40.6% of all children born were born to single mothers. The rate for white children was 35.7%, and the rate for black children was an astounding 71.8%.
Percentage of Families That Are One Parent Families
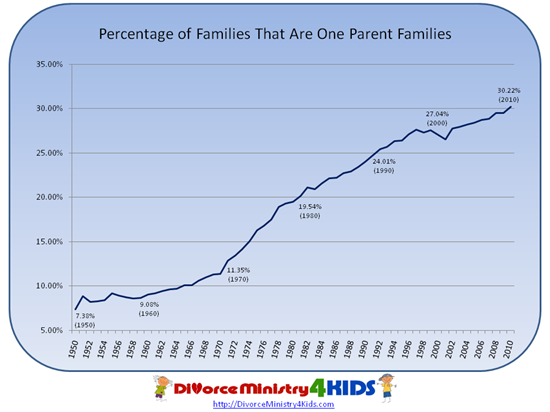 Another measure of the impact of divorce on children is the percentage of families in this country with children under 18 years of age that are single parent families. This would include single parent families created by divorce and those where the parents were never married.
In 1950, only 7.38% of families with children under 18 were single parent families. By 1970, that figure had risen to 11.35%. In the 20 years between 1970 and 1990, the total percentage more than doubled to 24.01% By 2010, over 30% of all families with children under 18 were single parent families. That means that nearly one in three families are single-parent families.
Number of Kids Living in Single Parent Families
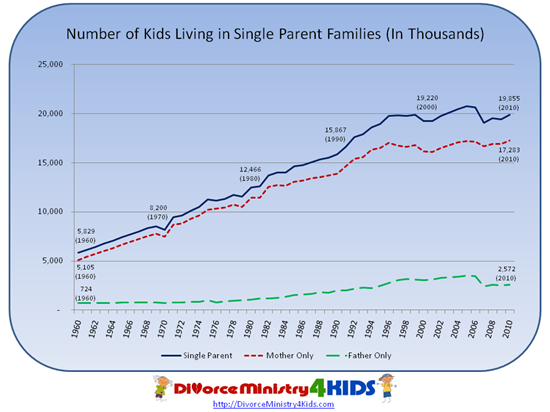 The prior chart looked at the total percentage of families with kids under 18 represented by single-parent families. This chart quantifies the total number of children in single-parent families as well as the number in both single-mother and single-father families.
Notably, while the number of kids living in single-father families is generally increasing, it is still significantly lower than the number of kids from single-mother homes.
The statistics show that, in 1960, 5,829,000 children lived in single parent homes. By 1980, the number had grown to 12,466,000. The number peaked in 2005 at 20,722,000. It has since decreased, and in 2010 the numbers of kids living in single-parent homes was 19,855,000. That represents 26.57% of all children under the age of 18. That means that out of every four children in your church, on average, one lives in a single-parent home.
Children of Divorce & Children Born to Single Mothers
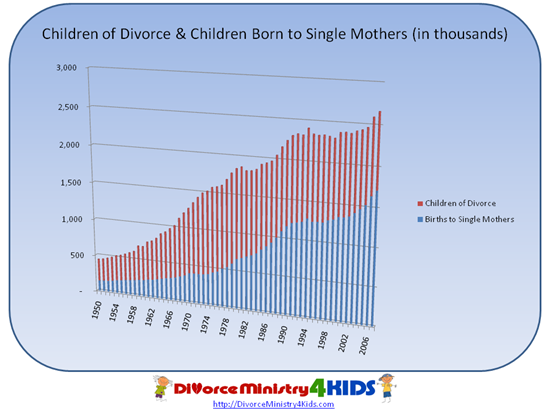 This last graph adds the impact of divorce on children to the number of births to single mothers to approximate the number of kids each year who enter the world of single parent families.
In 1950, 299,000 children went through the divorce of their parents and another 142,000 were born to single mothers for a total of 441,000 kids entering the world of single-parent families. In 1970, there were 870,000 children of divorce and 399,000 births to single mothers for a total of 1,269,000.
The number of combined children of divorce and children born to single mothers has continued to rise to 1,840,000 in 1980; 2,240,000 in 1990; 2,383,000 in 2000 and stood at an all time high of 2,661,000 in 2007.

Comments are closed.